
22+ Impressive Data Visualization Examples in 2024
By Sam Nguyen

Drive 20-40% of your revenue with Avada
As you already know, data is drowned every day. There is an estimation that 2,5 quintillion bytes of data are generated daily. And this is equal to around 90 percent of the world’s information that can be produced during the last two years. Now, it is called “big data.” However, most people will wonder where it comes from. We have more data from social media websites and sensors to digital pictures and videos than we thought. This is the reason why data visualization comes into the pic.
This article will learn what data visualization is and introduced to 22 Impressive Data Visualization To Learn.
Related Posts
- Digital Analytics: Ultimate Guide to Grow Better
- Benefits of Artificial Intelligence
- Order Management System
What is data visualization?
Data visualization is defined as representing data in visual contexts, including charts or maps, to help people understand the importance of the data.
While data in text forms can sometimes become confusing to you, data performed in visual formats will help people with the exact meaning from this data much more easily and quickly. You can get patterns, correlations, and trends exposed, which can be undetected.
Data visualization might be static and interactive. For ages, people have used static data visualization, such as maps and charts. Take note that interactive data visualization can be newer, allowing people to drill down into dirty details of those graphs and charts by using their computers or mobile devices, then changing the data they see and how it is well processed.
What makes good data visualization?
Good visualization needs to set up two kinds of presented data:
-
Indicate connections inside the data which are too complicated to explain with current words
-
Make it easy for viewers to quickly make out the information presented and take note of the results from that data
The complication will come from the number of observation categories, and it is a variable. Good visualization for displaying the statistical distribution of data numbers is known as histogram and blog plot if there is any interest in the modes and outliers. The visualization for categorical data had better display the frequency of distribution as well as skew. All of the typical visualization data in which observations are one variable. For example, a screen size of the laptop will become variables with the observations, including numbers listed for different sets of models.
One or two more variables will generate lots of complexity. You should bear in mind that one of the best visualizations will count on if the comparison is numeric to numeric, numeric to categorical, and categorical to categorical.
Visualizations reduce the complication inherent variable and data choices that assist the managers in getting a more unobstructed view of data. Those graphs should transfer the hierarchy of how data will be relevant to your business concerns, then revealing the underlying meanings which can speak out to targeted customers. Hence, should you present data to the marketing managers who are fond of online engagement, you will use the recognizable metric. You had better understand whom your customers are for the given visualization and what they should explain.
Interactivity will not introduce the complication. You can consist of interactivity over time in order to offer the rate when a result or metric happens or in a side by side comparison. Don’t forget the challenge always lies in the decision of what methods can tell the story. The research data is sometimes in the table; hence, opting for interactions for the comparison should be intuitive, typically if the visualization is well developed from any programming frameworks.
22 impressive data visualization examples and what you can learn from them
To get your work promoted, we have listed here more than 20 impressive data visualization examples and what you can learn from those examples. Besides, they also give you a better understanding of what will make useful visualizations and worsen them.
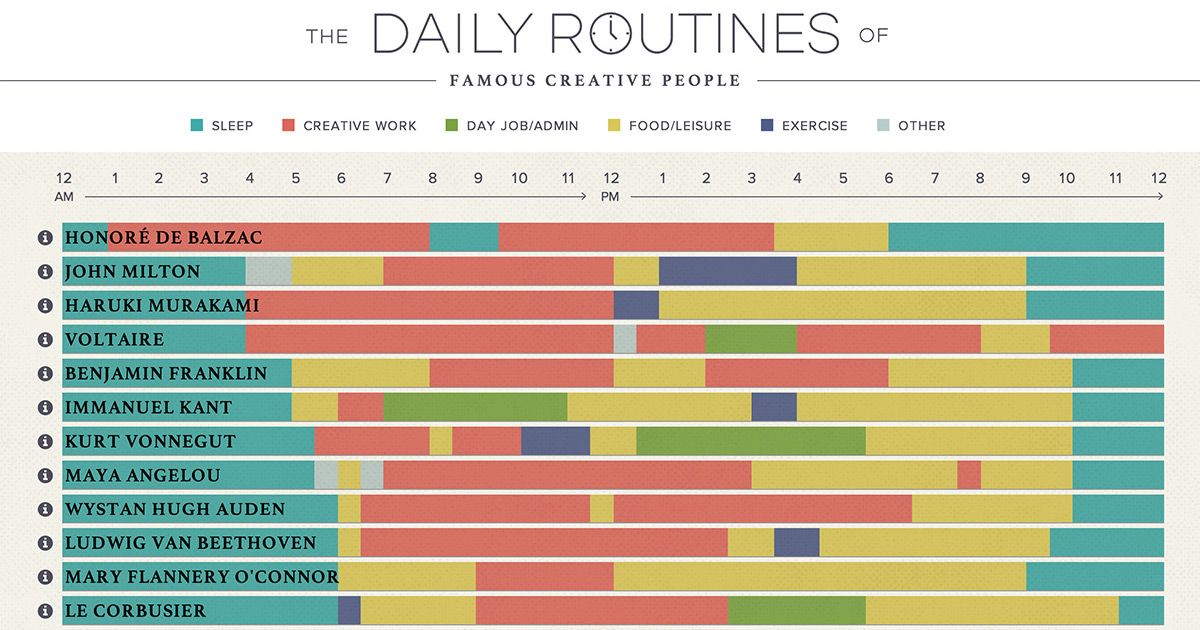
1. It is interactive
The Daily Routines of Famous Creative People is one of the most perfect examples of an interactive data visualization consisting of the important ingredients of an engaging and effective piece. This example is loaded with data into single pages, and it applies colors to identify the trends and lets viewers receive global senses of that data. It also attaches different users by enabling them to interact with the piece, and it is not so hard to figure out in single glances.
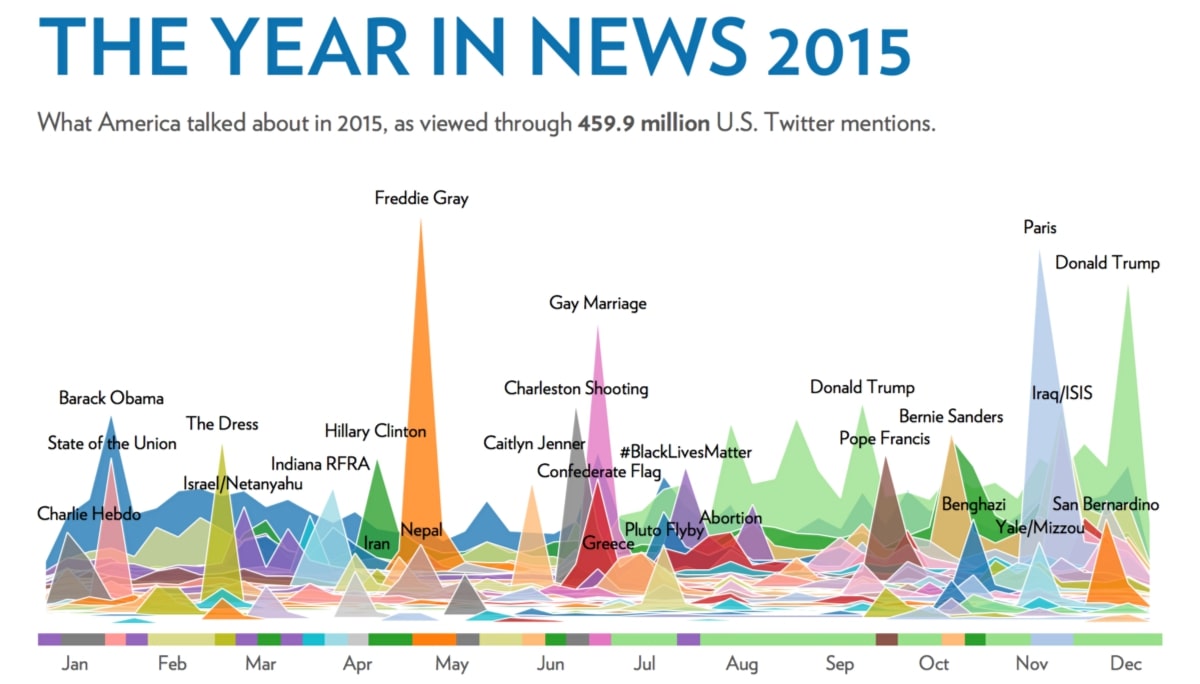
2. It discloses trends
The Year In News is another interesting example of how an executed data visualization can get patterns and trends that are hiding behind the sets of data relieved. Just by having around 184.5 million Twitter mentions analyzed, Echelon Insights could offer a bird’s eye view of what citizens in America were talking about in 2014.
3. It applies animation
As you can see, the Pew Research Center is listed among 20 impressive data visualizations examples of how trends and shifts over time can be communicated through executed animation. This kind of data visualization can pack lots of information into a visual with 23 bar charts combined into single GIF composites. And it can be shared on social media as well as embedded everywhere.

4. Real images are used
With multiple visualizations, it might be very hard for you to find out a special angle that has not been discovered yet. Using real-life photos as one of the infographics bases, Luttenberger can craft the whole report for organizations every year to offer assistance to drug addicts in Austria. Using real images can indicate this organization’s mission effectively and clearly.
5. It makes use of metaphors
There is another useful way to communicate any complicated ideas is through metaphors and symbols. For instance, this data visualization of the Internet was generated by Ruslan Enikeev. By applying the planets’ metaphor in a solar system, Enikeev can generate “Map of the Internet” helping users visualize the relative influence and reach of many sites outside. For example, the amount of site traffic will be represented by the circles’ size on this map.

6. It puts data into context
One of the most powerful data visualizations is their ability to put those pieces of information isolated into larger text. Nikon’s interactive piece aims to provide users with the objects’ size, including big and small, by applying comparisons. Besides the Milky way, a popular object like a car or a ball is likely to be smaller than you have imagined.
7. It is time-saving
Other hallmarks of effective data visualization are its own ability to summarize tons of information, and this whole process will help save your valuable time and effort. For example, this data visualization will indicate 100 years of rock evolution on every single page. It simplifies the information for you to condense information into smaller pieces, which can be seen in less than one minute and gives you audio examples for every genre from the electronic blues to the dark metal.
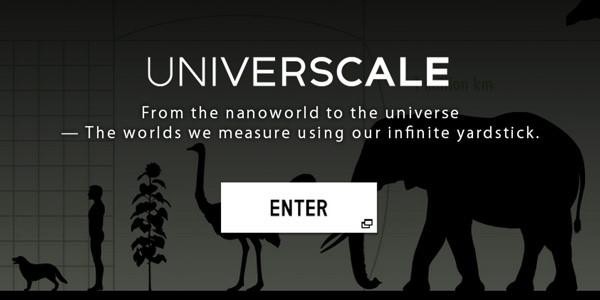
8. It provides you with perspective
As humans, we can’t help but view the Universe and life from our self-centered and completely unique perspective. However, this data visualization already informs us of lots of perspectives on our lives and even daily life events by getting them placed in the bigger context of time from current years to the present millennium.
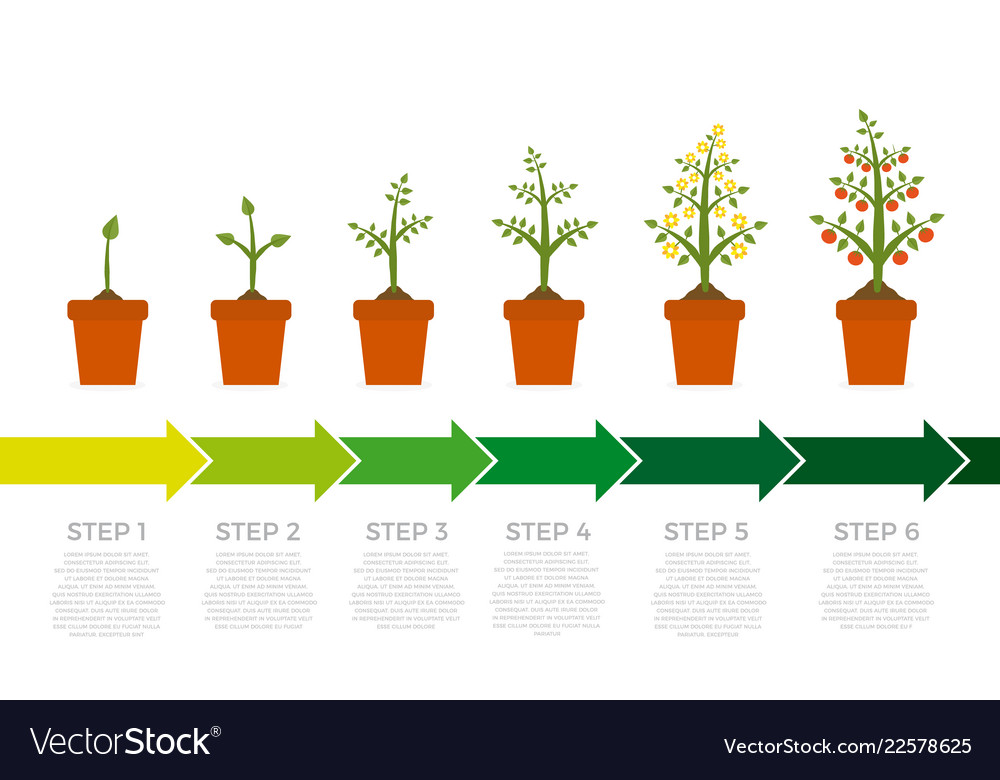
9. It explains a process
According to the objective of getting the complex to become easy to understand, the process of planting the seeds gives you a visual representation of a coffee bean’s adventure. By dividing the whole process into different parts, the data visualization does its good job of offering reader bite-sized pieces of information that are digestible easily.
10. It encourages users’ imagination
Take note a very good infographic will both do the work of digesting the complex data and encourage readers’ imagination by letting them conjure up various hypothetical situations and abilities. By dividing the whole process into different parts, the data visualization does its good job of offering bite-sized reader pieces of digestible information easily.
11. It performs data beautifully
The infographic below can take dense material like figures or indicators and presents it beautifully and clearly. The design is functional and straightforward deceptively and offers users many choices for interacting with graphics, including indicators, countries, and kind of relations.
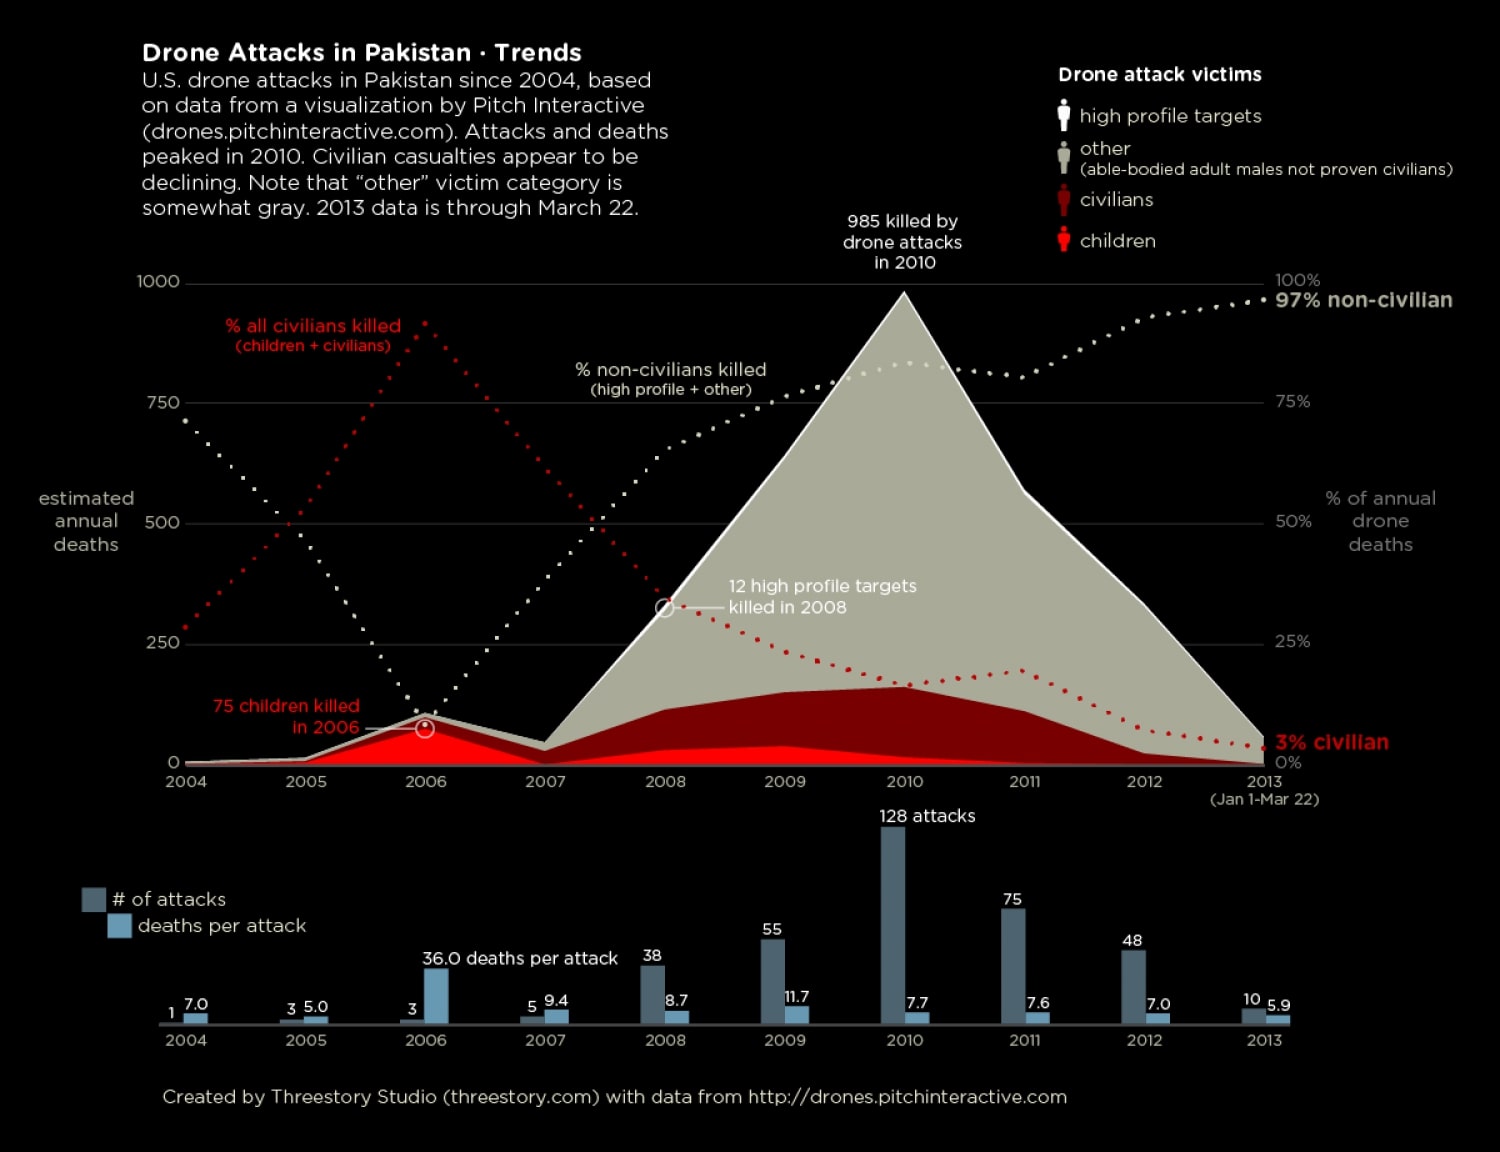
12. It tells you a story
A helpful data visualization both get information conveyed in convincing manners and narrates the story worth telling. For instance, a data visualization can tell you the story of a well-known drone strike and Pakistan victims. By getting information distilled into an understandable visual format, this story can disclose the disturbing facts that should not be unnoticed.
13. It is educational
Data visualization can go beyond a common one to be an interactive and educational minisite. By getting enough information and data combined to fill out an encyclopedia into every interactive application, this kind of data visualization can become a helpful classroom tool for students to learn about ocean, wind, and weather conditions.
14. It allows users to access to raw data
The data visualization consists of previous qualities that are mentioned and lets users have direct access to all of the original raw data. In addition, by making use of bubbles that are shaped in line with the size of a data breach, viewers can receive solid overviews of data breach “landscape.” Also, if viewers wish to reach details of the information, they can go as deep as possible by navigating various filters and raw data.
15. It gives users the power
Following global trends of giving access to the information as well as giving users the power, the data visualization is doing its perfect job of getting the process of balancing national budgets demystified. By setting the budget to balance in daily users’ hands, the project can tap into the collective thinking to deal with big issues.
16. Most valuable Sports Franchises
This is an example of telling a deep story by inserting additional data. The interactive, which is generated by Column Five, was already by Forbes “Top 50 Most Valuable Sports Franchise 2014” list. However, rather than only getting the list visualized, this interactive enables users to view the number of years that is competed and the number of championships winning. This can provide you with a comprehensive view of each team’s success and history like a franchise.
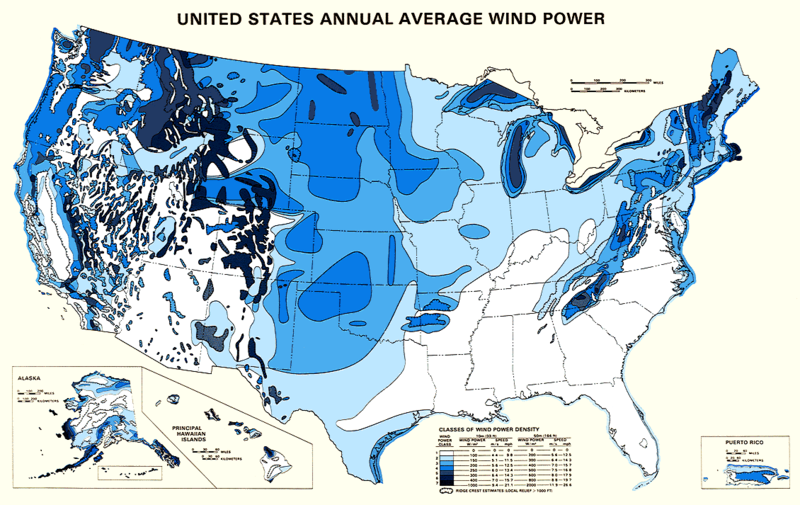
17. The U.S. Wind Map
This visualization is similar to the Thanksgiving flight maps. It can represent all of the current wind speeds and directions in the United States in real-time. The U.S. Wind Map is also an amazing example of perfect designs: Speed will be represented by how lines that move quickly or slowly, and the direction will be shown byways the lines move. It is clear what general trends are without any numbers requirements if you do not click into the map. Additionally, capping the number of variables at two will make it easy to follow.
18. Austria Solar Annual Report
While there exist various ways to get data visualized, using information subject to generating data visualization can be profound. This yearly report from Austria Solar uses real solar power to help bring about this enterprise’s data to life through solar-activated inks on this page.

19. Languages in the World
This interactive created by DensityDesign has done its excellent job of introducing the non-linguist to many world’s languages. This piece will enable you to discover popular language families and let them see which kinds of languages are spoken mostly and check where languages will be spoken all over the world. This is known as one of the greatest visual storytellings: taking in-depth subjects and breaking them down in an easily-understood way.

20. Percent of the U.S. Population by Age Group
This is known as one of the most powerful examples of getting single data sets presented perfectly Furthermore, Pew Research generated an animated GIF composite to help show shifts in population demographics during the time. It is considered among the best ways to tell bigger stories in neat packages.
21. Data Grammar
Data about data is not always boring as it looks. For example, Datar Grammar is a delight. It has not been widely explored by larger publications and has not won awards; however, that does not mean it is not worthy of the list. Data Grammar is known as a beautiful glossary of data’s chart visualization. Colors are inspirational, and the combination of white and black photos with conceptual labeling provides the design with completion.
22. Global Commodities
Spinning globe visualizations are very beautiful for you to take a closer look. Sometimes, they are full of data popping up in various colors. In this case, data visualization is about global commodities. The data then is about imports as well as exports around the world for ten years over time. The visualization becomes interactive in line with kinds of cargos, locations, and years.
Further readings
- What is E-commerce? Everything You Need to Know!
- What Is An Electronic Check? 10 Questions About Electronic Check
- What is a UPC Barcode? How to generate, Get or Buy UPC Barcode
Summary
Interactive data visualizations are special that they happen to some five senses from the sense of hearing through audio, the sense of touch through the interactive experience of hovering, clicking, and scrolling through content to the sense of sight through stunning visuals. While you think data visualizations are too expensive and time-consuming to create on your own, you can discover a few free tools that enable non-programmers and non-designers to produce interactive content. We hope that with our complete guide on 22 Impressive Data Visualization To Learn From, you can easily make use of data visualizations to make your business develop over time.


New Posts


